Hard Numbers: How to Improve Your Data Analysis for the Workforce
Author: Zenresume Editorial Team
Updated on March 05, 2021
You’ve probably heard the adage, “Know your audience.”
Whether you’re doing your day job, building a business, or launching a new product, understanding the needs, wants, and pain points of your consumers will make or break your professional success.
The more you know your audience, the more you can customize and continuously improve customer experience.
This will help you stand out from the competition. That, in turn, will bring satisfied, loyal, long-term customers.
So how do you get to “know your audience?”
In a word—
Data.
Data analysis, or data analytics, is one way to build an in-depth understanding of your audience.
Today, more data is available than ever before. The most successful businesses use this data to:
- Anticipate customer needs/wants
- Optimize the customer experience
- Build more relatable, more successful marketing campaigns
- Create relevant product and service offerings
- Personalize customer interactions, making customers feel valued
And that’s just the beginning. Data analysis can help you increase productivity, make decisions, communicate important ideas, and even discover unexpected inspiration.
The Importance of Data for Your Business
With data analysis, you can build a better understanding of your target audience and your marketplace. This knowledge allows you to solve problems and make better decisions, saving you time and money.
You may, for instance, be familiar with Netflix. Netflix uses data analytics for targeted advertising. Using search and watch data, the company sends emails to subscribers recommending movies they may enjoy.
This data is also used to order movies that might interest the subscriber on the main menu. With data, Netflix forms a picture of each individual’s interests and preferences. This information is used to create a more personalized, engaging experience.
Remember your last “Netflix Tonight?” email? It fit your interests perfectly, right? You got a list of solid recommendations begging you to pop some popcorn and settle for a nice binge-watching session.
But you don’t have to be a giant like Netflix to benefit from data analytics.
Small businesses can use data to provide personalized recommendations, too. They can also use data to analyze web traffic, measure the effectiveness of social media strategy, improve products by tracking customer opinions, and find solutions to unique problems.
At the Point Defiance Zoo and Aquarium in Tacoma, Washington, for example, attendance depends on the weather. The zoo uses historical attendance records and years of local climate data to better predict outdoor zoo attendance. This helps with staffing and timing the launch of promotions.
When it comes to data analytics, the possibilities are nearly endless.
Storytelling with Data
Not only is data a great way to learn new information, but it’s also a valuable way to provide information to your customers.
Customers may use data to make decisions about buying products and services. But most customers don’t want to read through lengthy reports, and many won’t understand the finer points of data.
If you know what matters to your audience, you can present data in a way that is clear and actionable.
And if you know what you want your audience to learn from the data or do with the data, you can choose the best format to present this information (tables, bar graphs, line graphs, heat maps, and so on).
For example, Airbnb’s brand story is about helping people find a home away from home anywhere in the world. The company represents this story with data using an interactive map that shows where in the world Airbnb customers are staying.
Source: airbnb.com
And cell phone provider advertisements regularly use coverage maps to tell the story that their coverage is superior to “the other guys’” coverage. Like in this example:
Source: t-mobile.com
You can use a timeline to show how your business has grown over time, infographics to visually represent your products and services, charts and graphs to show how customers use your products and services (a la Spotify), and much more.
Here’s a Spotify tool segmenting different types of music students from 50+ US universities listen:
Source: students.withspotify.com
Whatever strategies you use, data allow you to share stories in a memorable, impactful visual format.
How to Improve Data Analysis Skills
So, you understand that data offers enormous benefits to your business. But no matter how much data you collect, it’s not useful if you don’t know what to do with it.
Here are seven tips to help you improve your data analysis skills.
1. Set a purpose.
Before starting any project, you need to have a goal. This gives you a sense of direction and helps you chart your course.
Before collecting and/or analyzing data, ask questions like:
- What do I want to achieve with this information?
- What problem can this data help me solve?
- How will I use this data to better understand my customers?
- How can this understanding help me provide a better customer experience?
Diving into a deep sea of data can be a tremendous waste of time if you don’t know what you’re looking for. Once you have a clear set of business questions, you’ll be able to collect and analyze data efficiently and effectively.
It can also be helpful to set a hypothesis: “I believe __. If I am right, we will __.” Thinking about strategy from the get-go can ensure that you do more than passively collect data. You’re ready to take action.
2. Understand different data collection methods.
There are many types of data analytics and ways to collect data. Depending on your goals, you can look at:
- Transactional data—Track what customers purchased, how much they purchased, when they purchased, how they paid, if any promotions/coupons compelled them to purchase, etc.
- Referral sources—Collecting information on how your customers heard about your business shows you where your customers are coming from, providing inspiration on how to find more.
- Demographic information—Demographic information allows you to provide highly targeted marketing efforts.
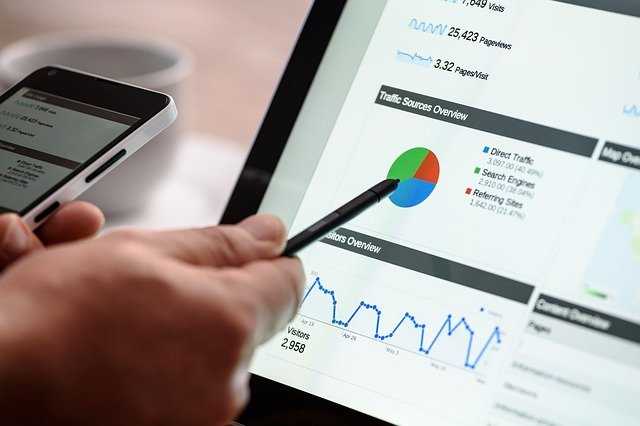
- Google Analytics—Provides information about how customers get to your site, how long they stay, what pages they visit, which pages are performing best on your site, etc.
- Google Trends—Tells you what keyword searches are popular by region and can help you determine hot topics among the demographics that matter to your business. Leverage this information to show up in your target audience’s searches.
- Social media analytics—Learn more about your social media followers and use resources like Facebook marketing tools to target customers that mirror your current following.
These tools and others give you valuable information about who your customers are and what drives them to visit your store or website and make purchases.
With this information, you can develop a customer profile and learn how to attract and retain customers. Learn what draws them to your business, what products, services, or site pages they like the most, and what motivates them to buy what you’re selling.
If you have a website, you can also learn what areas of your site are losing visitors. How can you fix these areas or make them more like the pages your customers seem to love?
If you know your goal and have a general idea of what data you’d like to collect, you can research the best tools to get the job done.
3. Make it visual.
It’s likely that not everyone on your team is comfortable with numbers. Some may tend to glaze over at the mere mention of the word “data.”
Create visual representations of your data to ensure your entire team is informed and engaged. When appropriate, visuals are also a useful way to share your data with customers.
Plus, visuals make it easier to identify actionable insights. And that’s what data is all about—new info about your business or customers is useless unless you find a way to use it.
4. Compare perception to reality.
Before moving on to the next step, compare your hypothesis and your initial perceptions to reality. In some cases, your customer profile may differ from what you originally expected.
Don’t be afraid to let those old ideas go. Adjust as needed.
5. Plan how to use the data.
Once you’ve visualized and analyzed the data, what will you do with it?
Identify the insights you’ve gained from the data. What did you learn about your customers? It’s useful to focus on customer reactions (e.g., “If we do X, they are likely to do Y”).
Work with your team to consider several different options, then choose the best marketing strategy to pursue.
6. Evaluate the success of your plan.
Collecting data doesn’t stop once you’ve settled on a plan. Continue gathering data and conducting tests to measure what worked and what didn’t.
How successful was your plan? How cost-effective was it?
Use this information to make minor tweaks (or major changes) to your marketing plan. Continue testing until you’ve found a strategy that works for you.
7. Repeat.
Once you’ve reached your initial data-related goal, set another one. Continue getting to know your customers. Find new ways to improve their experience and create brand loyalty.
And don’t forget to build strategies to attract new customers, too.
So, what do you think?
How will you use data to learn more about your customers? What do you predict you’ll learn? If your hypothesis is correct, what action will you take?
If you’re already using data analysis, how has it benefited your work?
I’d love to hear from you in the comments!


